
Why video games cost so much to make
Scope, scope, scope


Last time, we showed that dev costs have genuinely skyrocketed. But “budgets are rising” is like saying “the patient has a fever.” We’re seeing a symptom.
What we really want to know is why: What’s causing this rise? Take a 2015 game and a 2025 one of the same genre, with the same ambition: does that game really cost more to make today? Or are we simply building different (more ambitious) games now? Solodevs ship multiplayer 3D games that would’ve taken a full studio not so long ago. Meanwhile, AAA now involve hundreds, if not thousands, of workers for up to a decade. And kitchen sink games are becoming a thing.
We already proved that inflation is a major culprit (+28% compounded since 2017), but it’s far from enough to explain the full story. From here on, every figure is inflation-adjusted, so we can focus on the remaining drivers of this increase.
A heads-up: this topic is not trivial, so this article’s a hairy one. We wanted to go deep, but we also wanted to keep it digestible. If you’d rather skip the details, the conclusion is waiting for you at the bottom.
Bigger scope or bigger teams?
“Salaries are up. Games are more complex. Teams are bigger. Projects take longer.” That’s the usual narrative for the cost rise. It’s all true BUT too vague. Two different stories might hide in there. In one, games genuinely got more ambitious, and bigger games cost more. In the other, making the same game now eats more people and time than it used to. If we can’t tell them apart, we end up fixing the wrong problem.
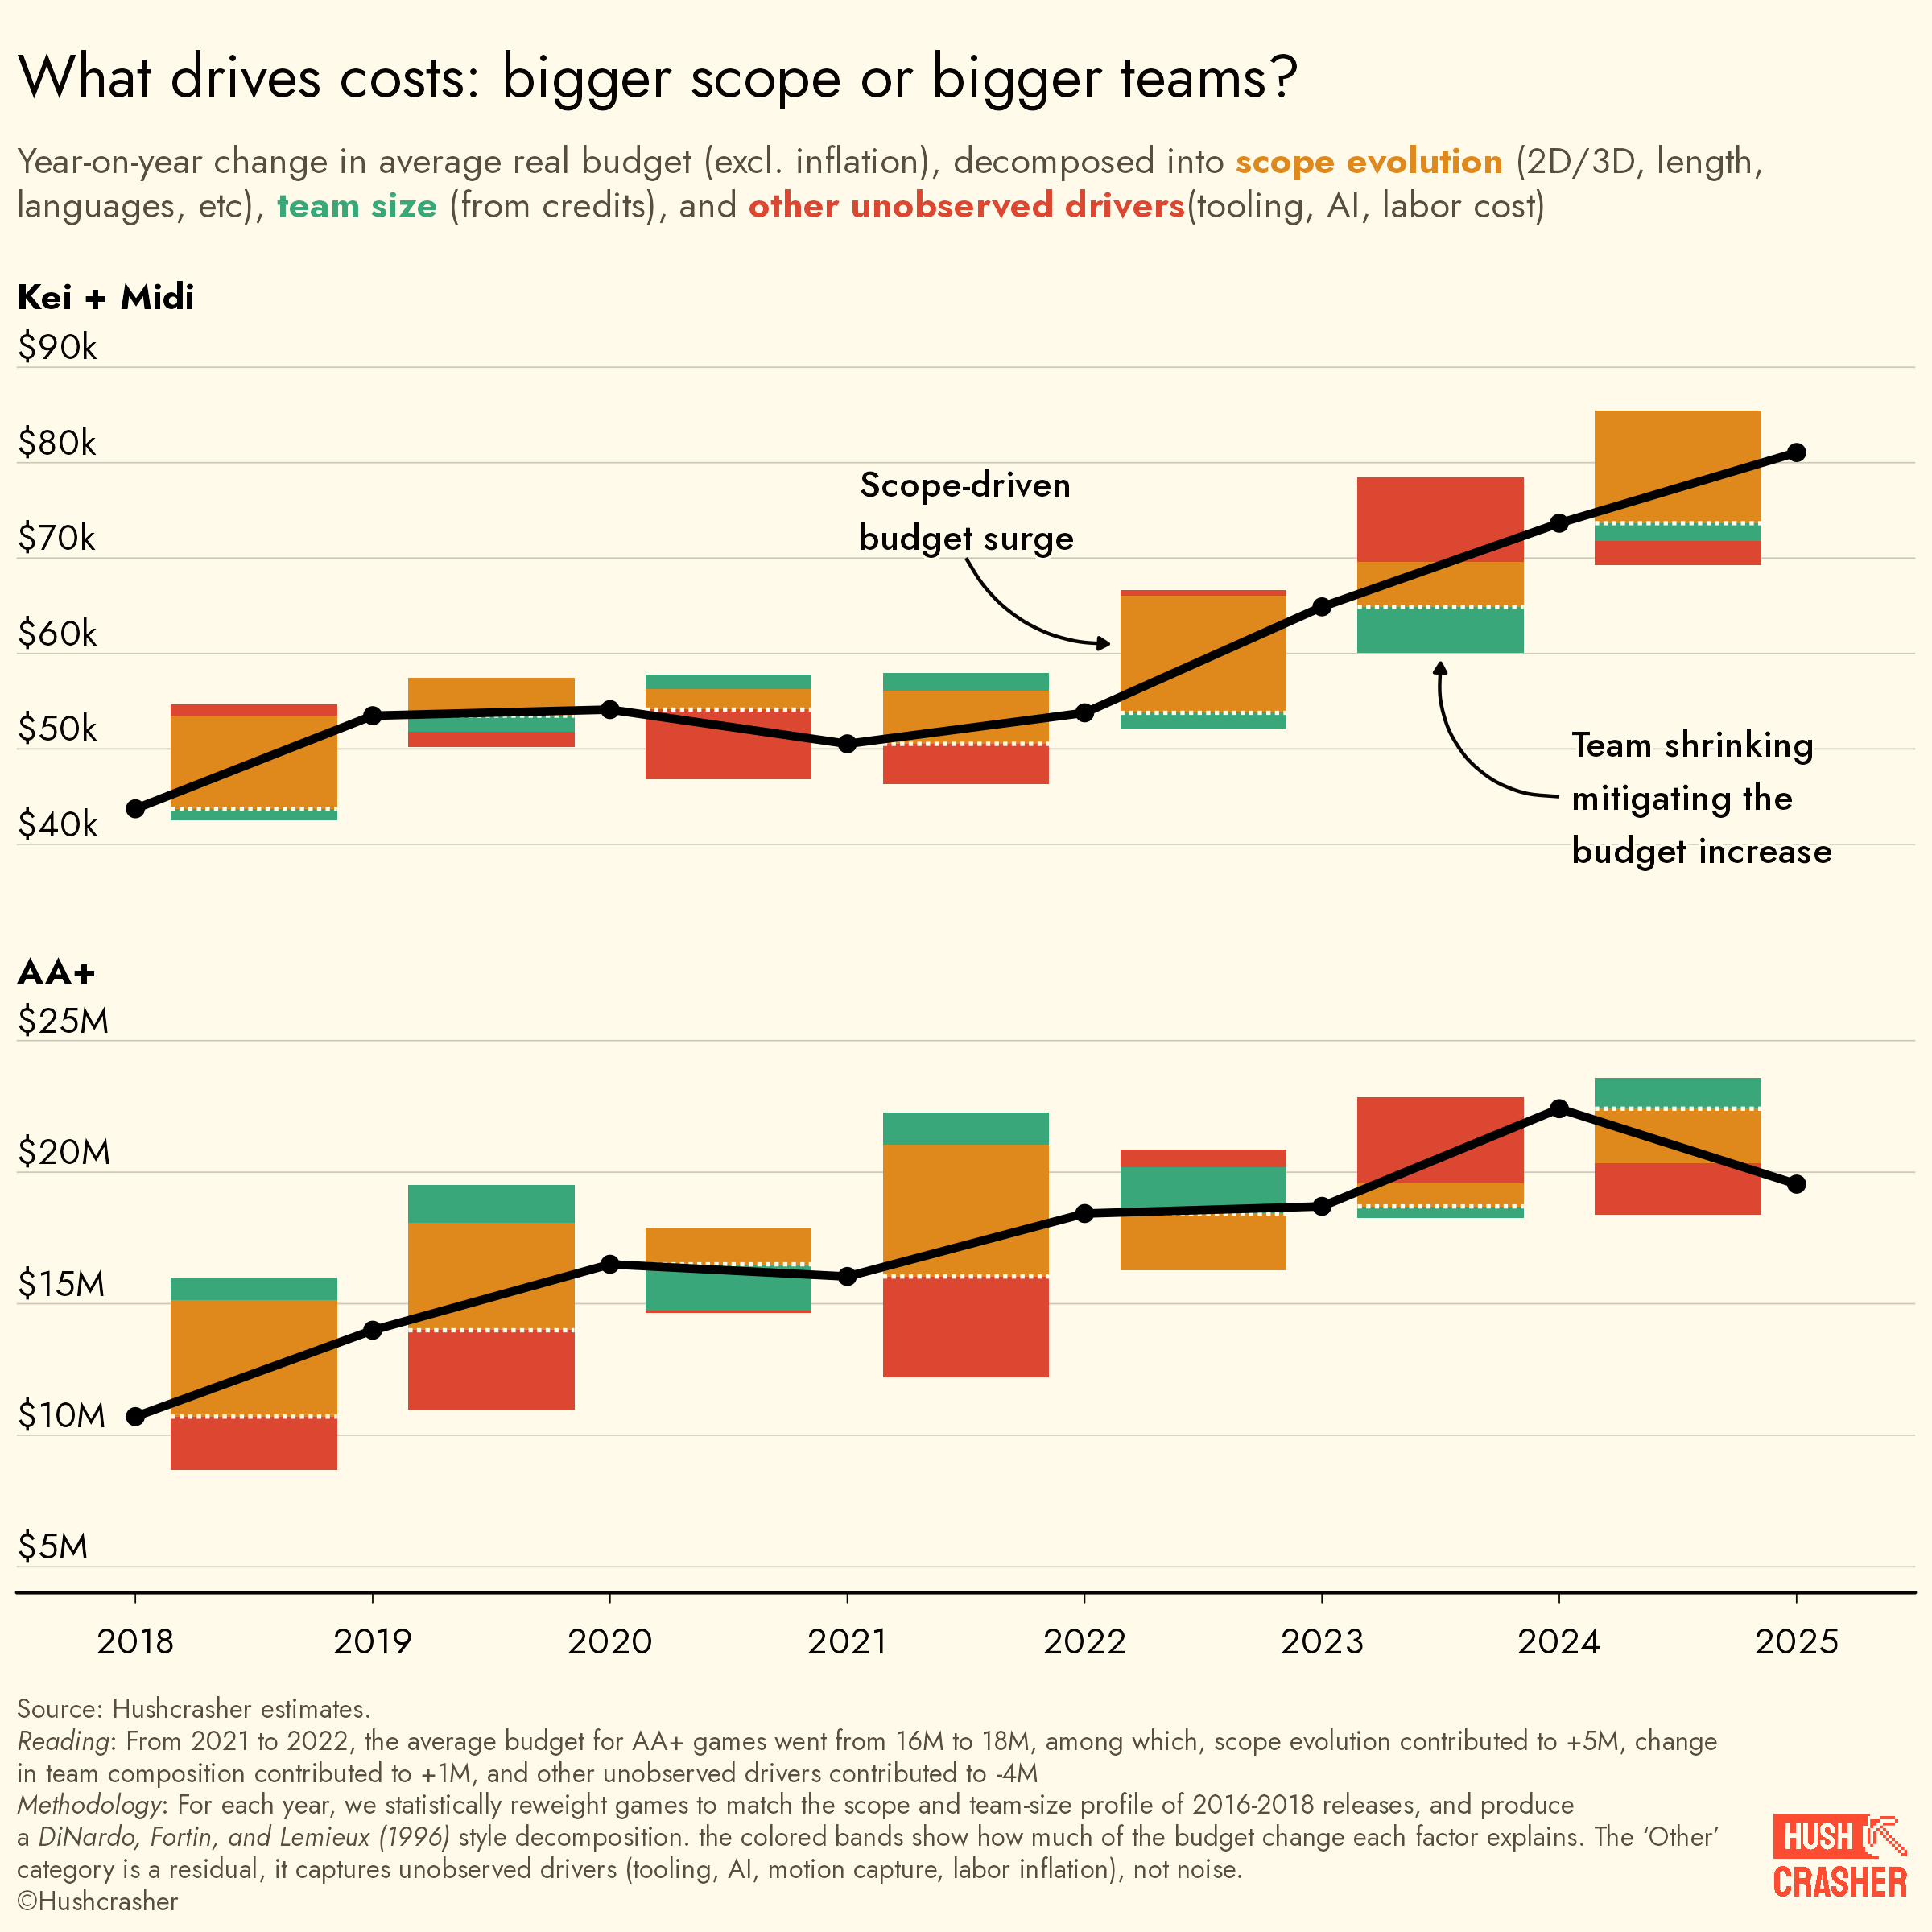
So when budgets rise, how much of it is the game itself getting bigger, and how much is everything else? We decompose each year’s budget change into three pieces: scope (games actually getting more ambitious and complex, in ways we can measure), team size (more or fewer people, holding scope equal), and a residual that captures everything we can’t systematically observe across 100k+ games (efficiency gains, tooling, AI, graphical fidelity, mismanagement).
The decomposition follows DiNardo, Fortin, and Lemieux (1996). We reweight each year’s releases so their scope and team-size distributions match the 2016–2018 baseline. The gap between reweighted and baseline is the “other” residual. The gap between actual and reweighted budgets splits into scope and team.1
For Kei and Midi, scope kept expanding year after year. Team size, by contrast, has been contracting since 2023, working against the budget rise.
If “Kei” or “Midi” don’t ring a bell, we previously defined four data-driven categories of game scope: Kei (solodev), Midi (small studios), AA, and AAA.

For AA and AAA, scope has plateaued (and even contracted) since 2023, while team costs kept rising. The 2023–2024 layoff waves may push team sizes down further in the future, when labor shrinkage will finally surface in new games’ credits. “Other” turns out to be the single biggest downward force on AA+ budgets. By definition, it’s the factors we do not observe, but we can speculate it’s driven by efficiency gains (better tooling, shared asset libraries, AI). There is a dip in team size from 2020 to 2021, almost certainly a composition artifact: COVID delayed many large releases to 2022+, leaving those years skewed toward smaller productions.
We have a scoop: it’s scope
If we tally it all up, we can say this: inflation aside, it doesn’t cost more to make games. We just make bigger ones.
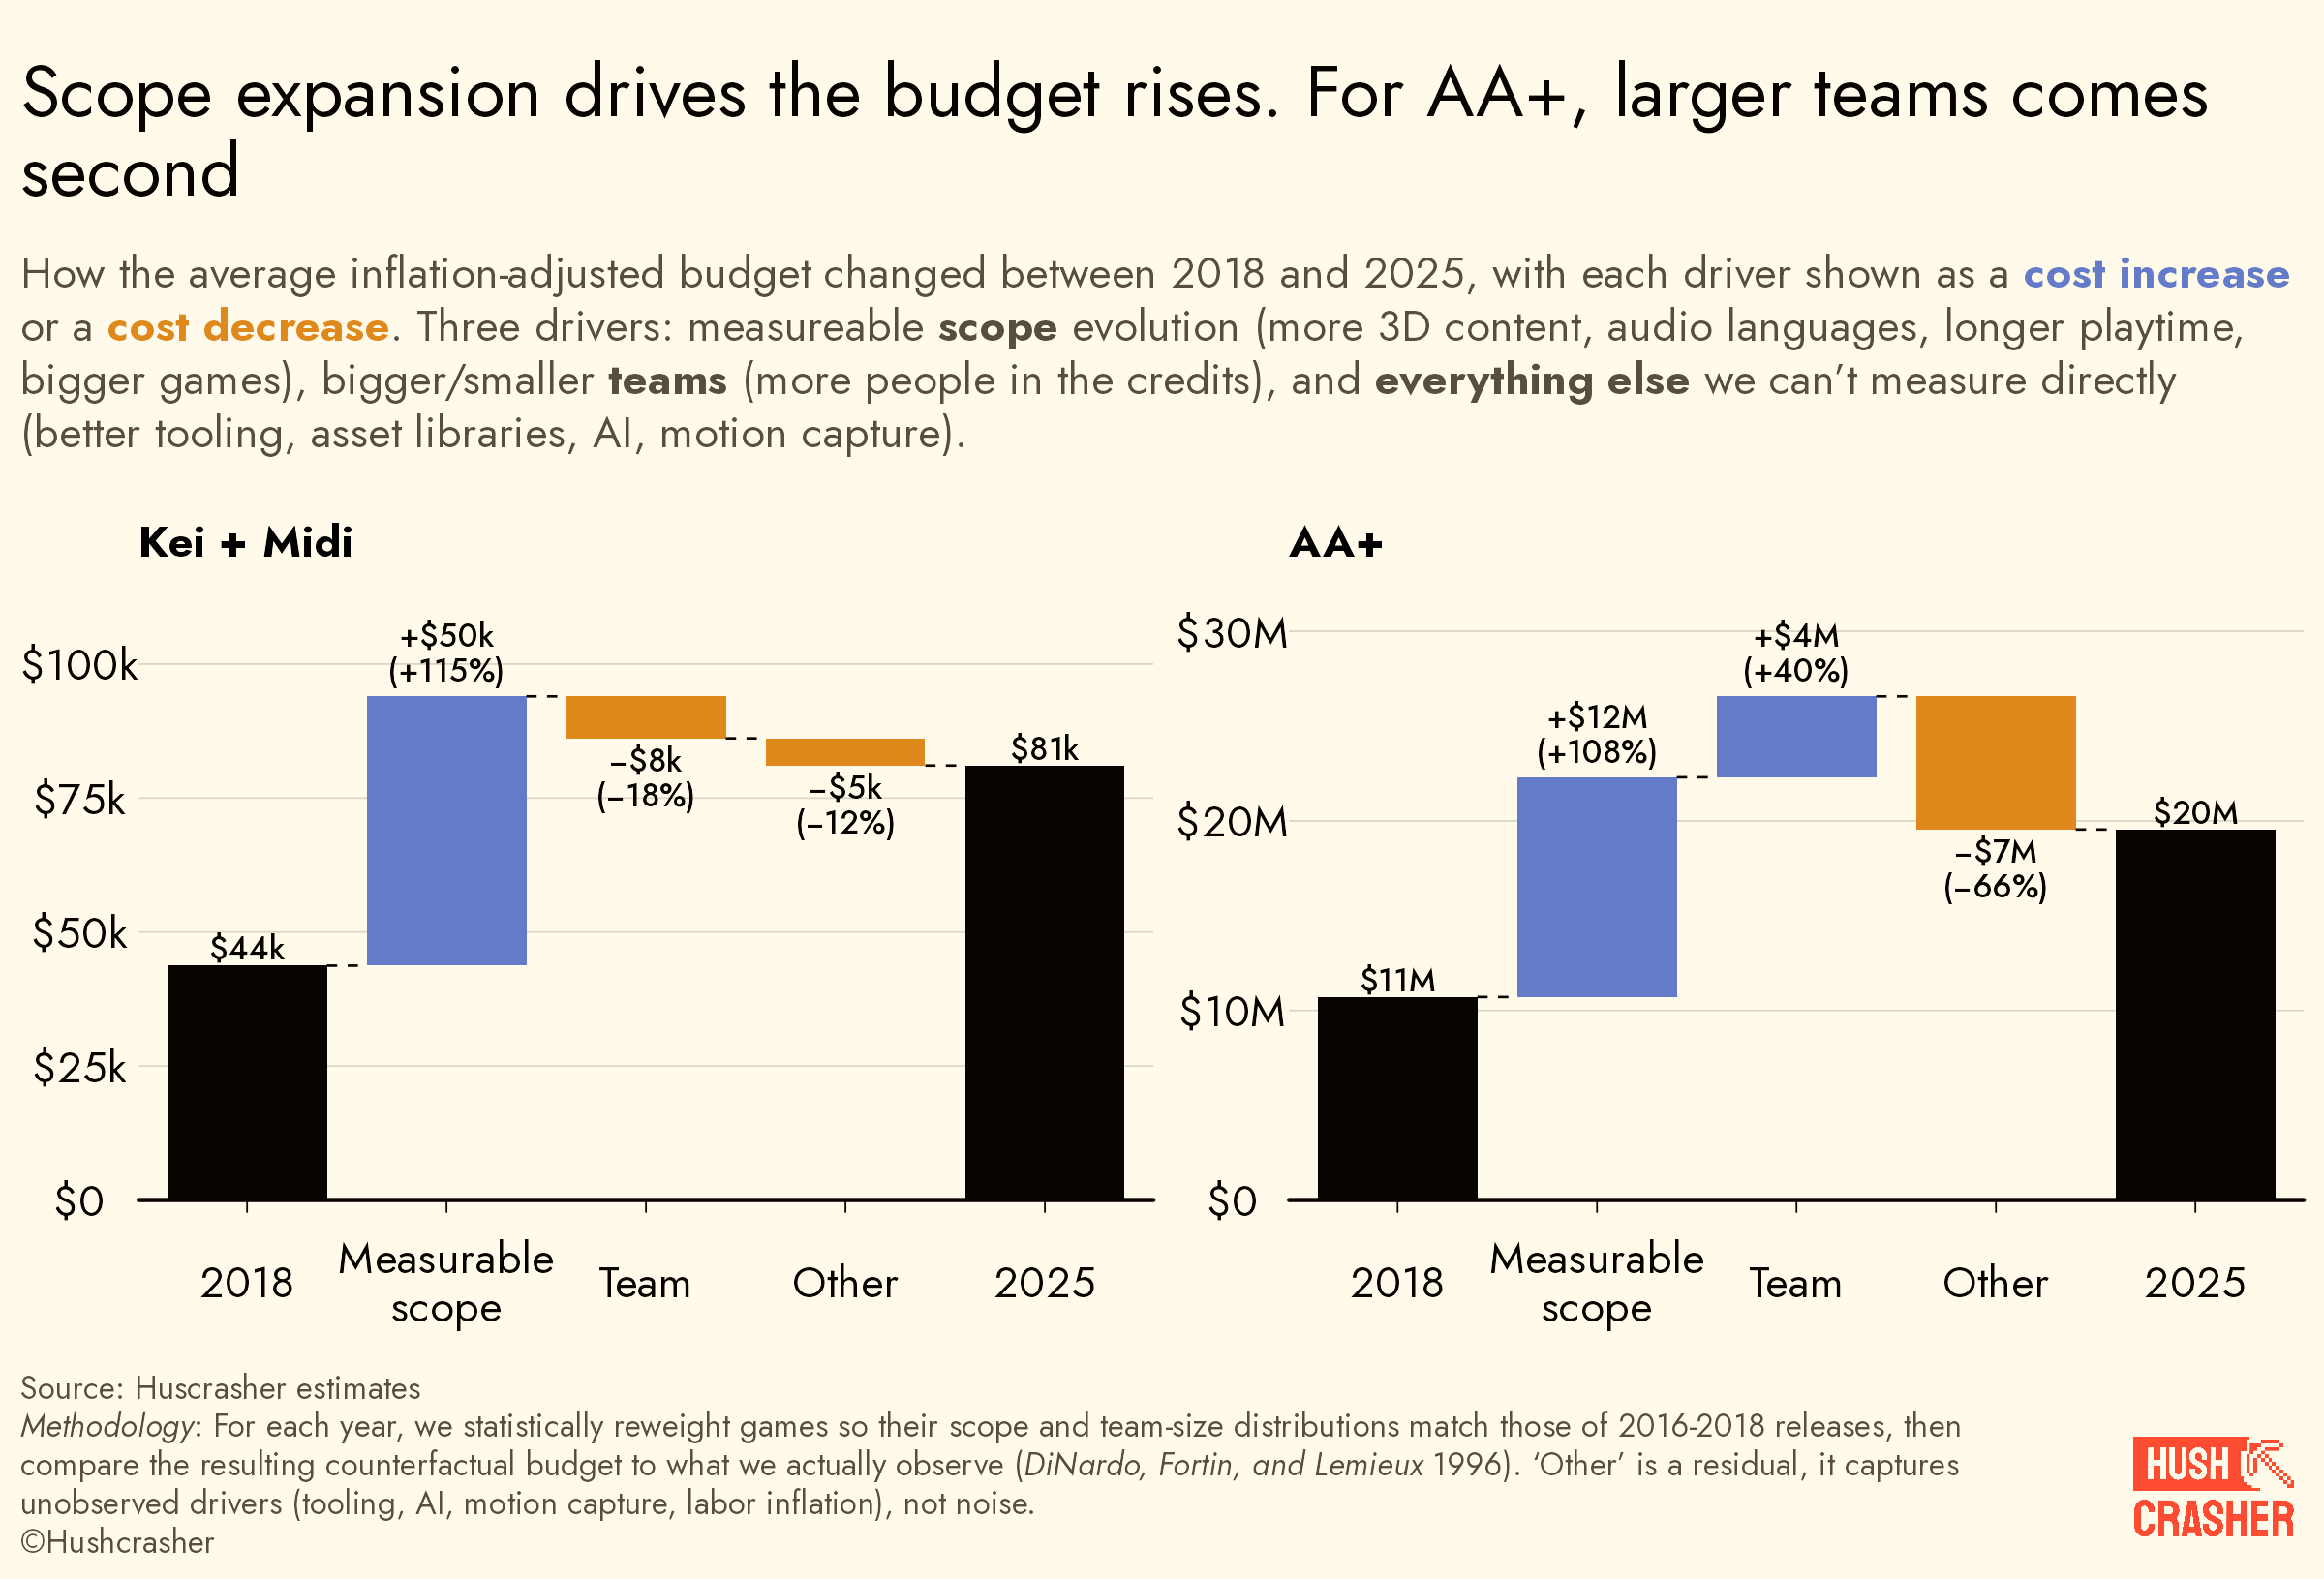
First, scope expansion alone is the main factor that can explain the average budget rise. Second, scope rise doubled costs across every game category.
For Kei and Midi, scope expansion did not scale with team size. In fact, it’s the opposite. They are pulling off bigger scopes with fewer people.
For AA & AAA, team size seemed to outgrow scope, meaning it now takes more people to ship the same product than it used to. Still, this could be entirely explained by scope rise that we can’t measure (e.g., motion capture isn’t visible in our data. If a game uses it, we just observe more people in the credits and might mistake it for plain team inflation). The sole downward force is the residual factors, reducing budget by $7M. It could come from unmeasurable scope cuts (e.g., a trim in graphical ambition), or genuine efficiency gains. Probably a bit of both. Either way, without those quiet savings, AA+ budgets would have grown even faster than they already did.
Why did team size expansion drive cost up so much for AA+ titles and not for small ones? What do those studios do differently with their teams?
This is part of our Budget series, breaking down the costs of making games.
The Great Specialization
First, they specialized. We looked at the variety of distinct job titles in game credits since 2015: it has increased, for everyone. A decade ago, the typical AAA listed fewer than 30 distinct roles. Today, 35% of AAA credits list more than 50. The trend reached lower tiers too but to a lesser extent. Besides, that might mostly be an increasing use of outsourcing: what used to be a single “Developed by” line now splits across external localization, art, or music.
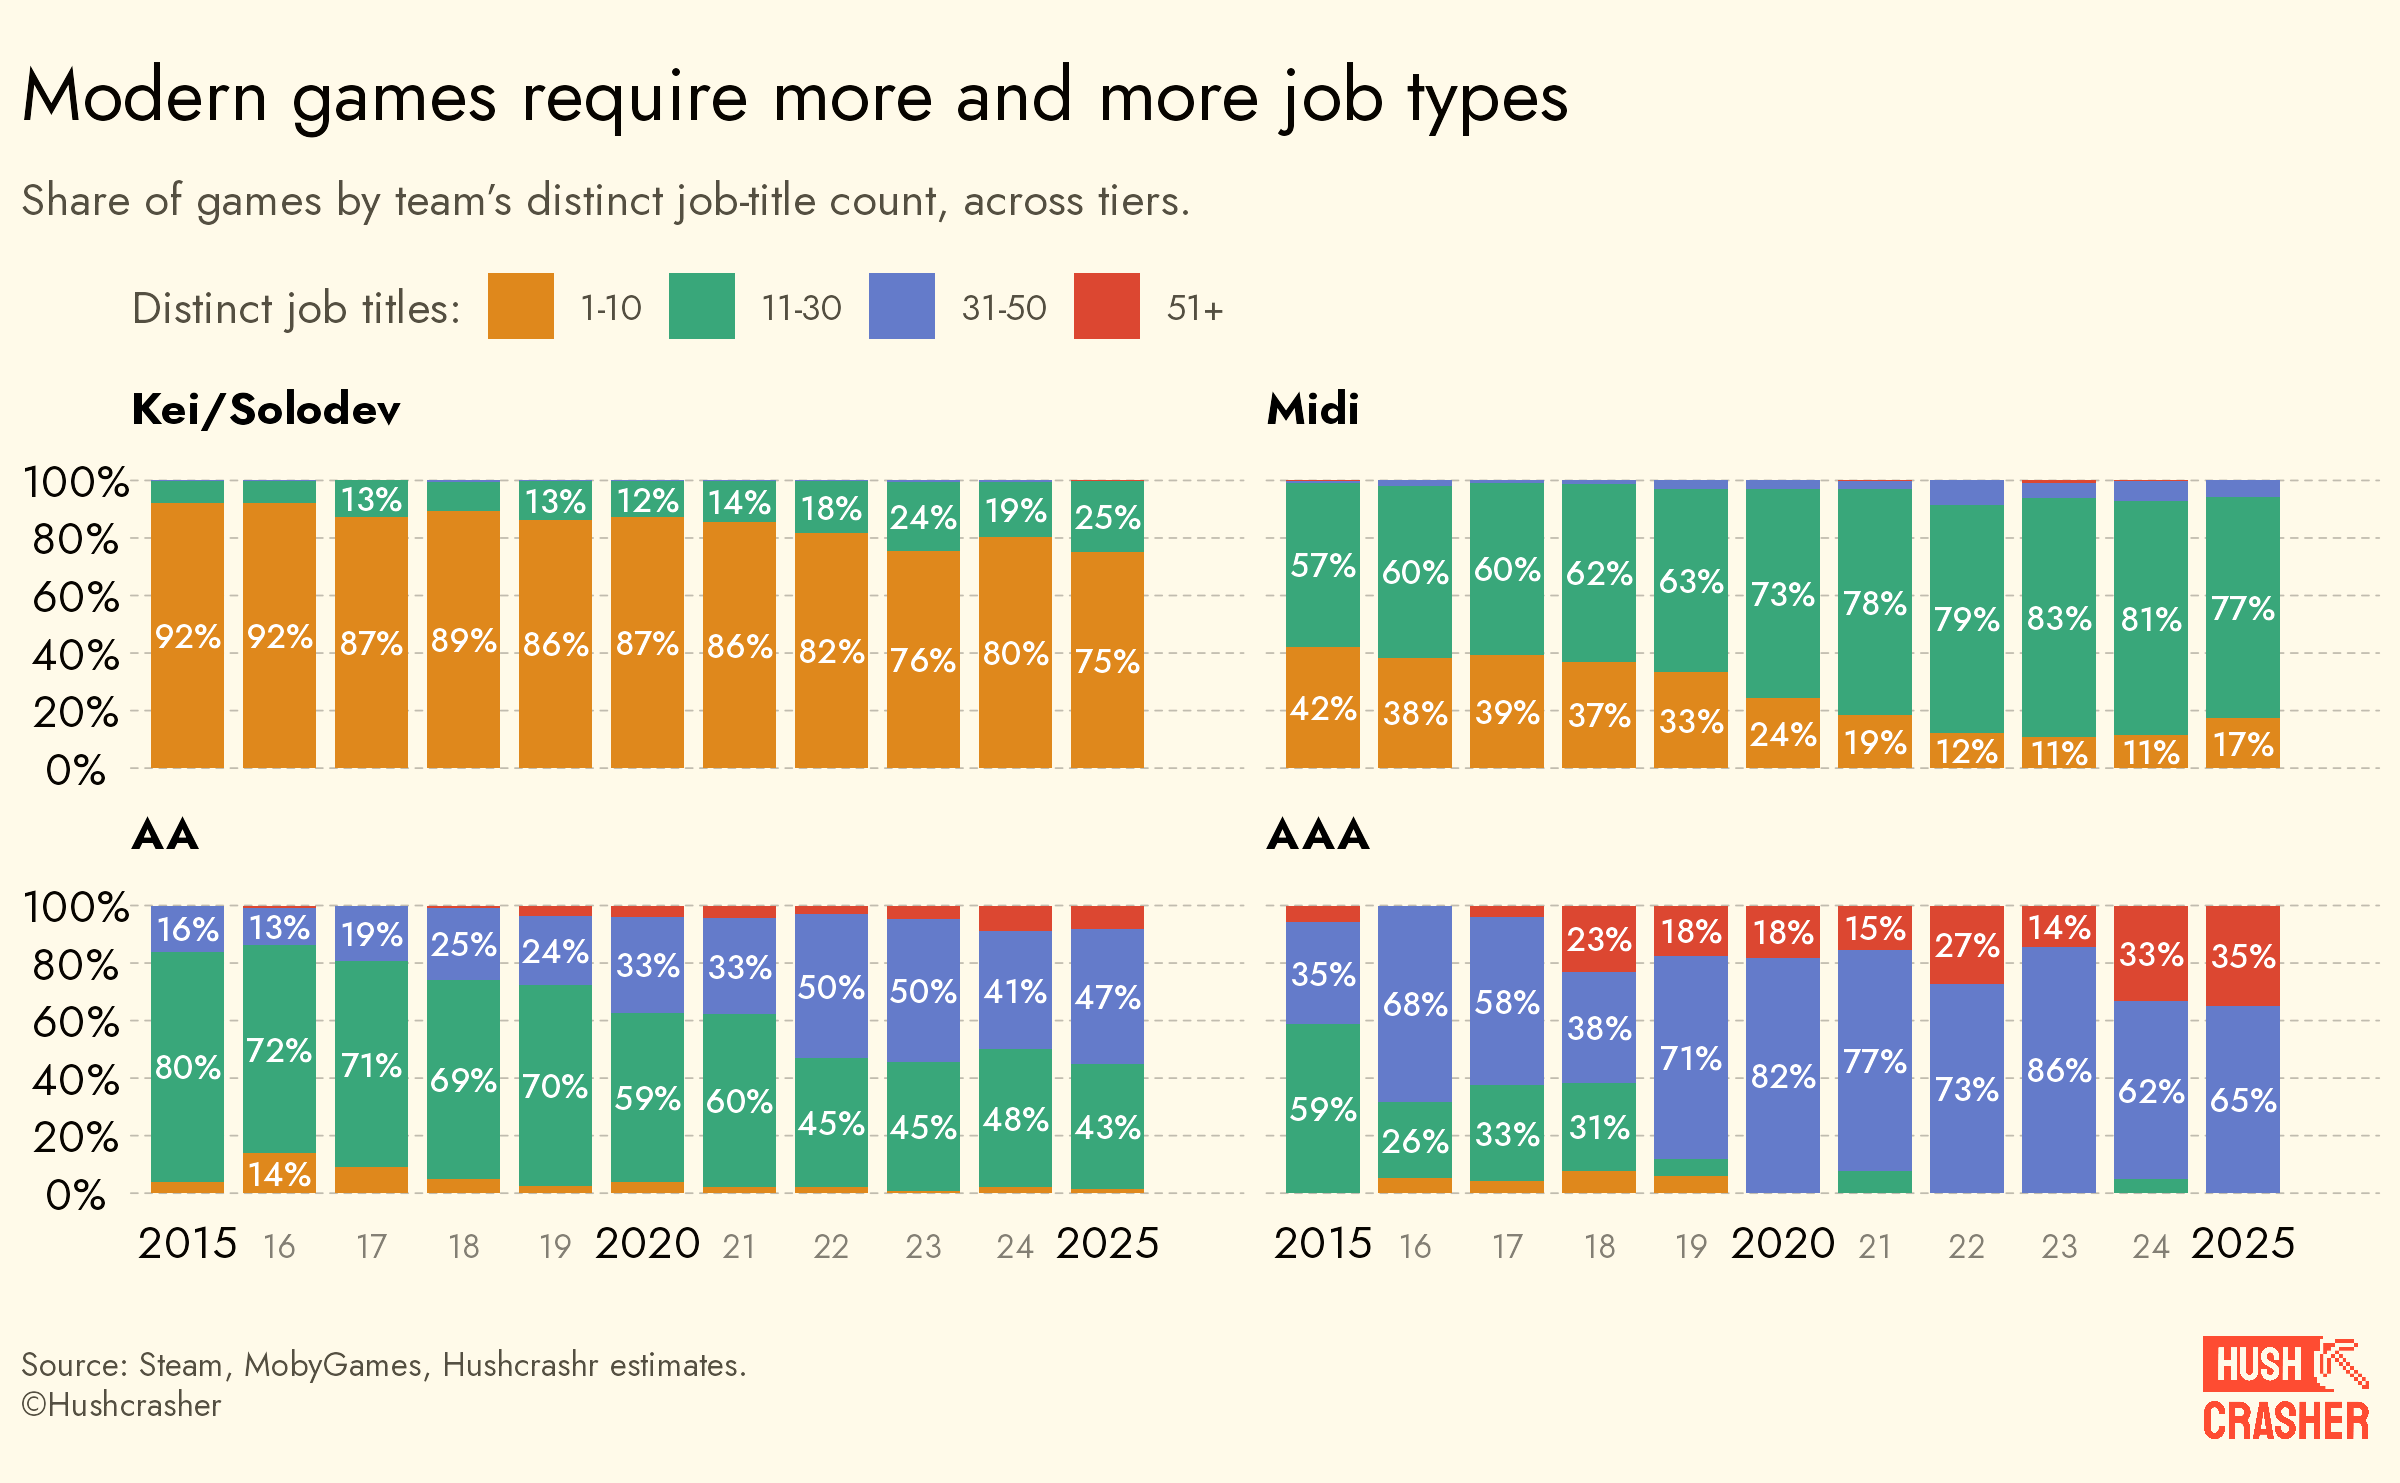
This job title expansion is probably due to both a rise in the complexity of games, and maturity of the industry. Cinema went through the same pattern, with new roles emerging alongside technical innovations.2
Wait, isn’t specialization supposed to make things cheaper? You get good at one thing, you do it faster, costs go down. Except that logic only works for repetitive and predictable work. Game development is the exact opposite. Nothing is repetitive, dependencies are everywhere, and stuff breaks constantly. In that kind of work, gains from increased specialization are eaten by the costs of coordination.3 A solodev who’s blocked on one task can pivot to another. The animator has to wait for the rigger to ship the new skeleton.
Coordination tax
Second, they hire managers. The growing specialization of organizations makes coordination a real challenge. Consequently, the share of credits with managerial titles evolved hand-in-hand with scope.
In AA and AAA productions, 14% to 17% of credits are management roles.4 That’s 1 in 7 people whose job is to manage other people. For Midi games, it’s below 1 in 10. For Kei, obviously, it’s a flat 0% because solodevs don’t credit themselves as ‘Senior Director of Loneliness’.
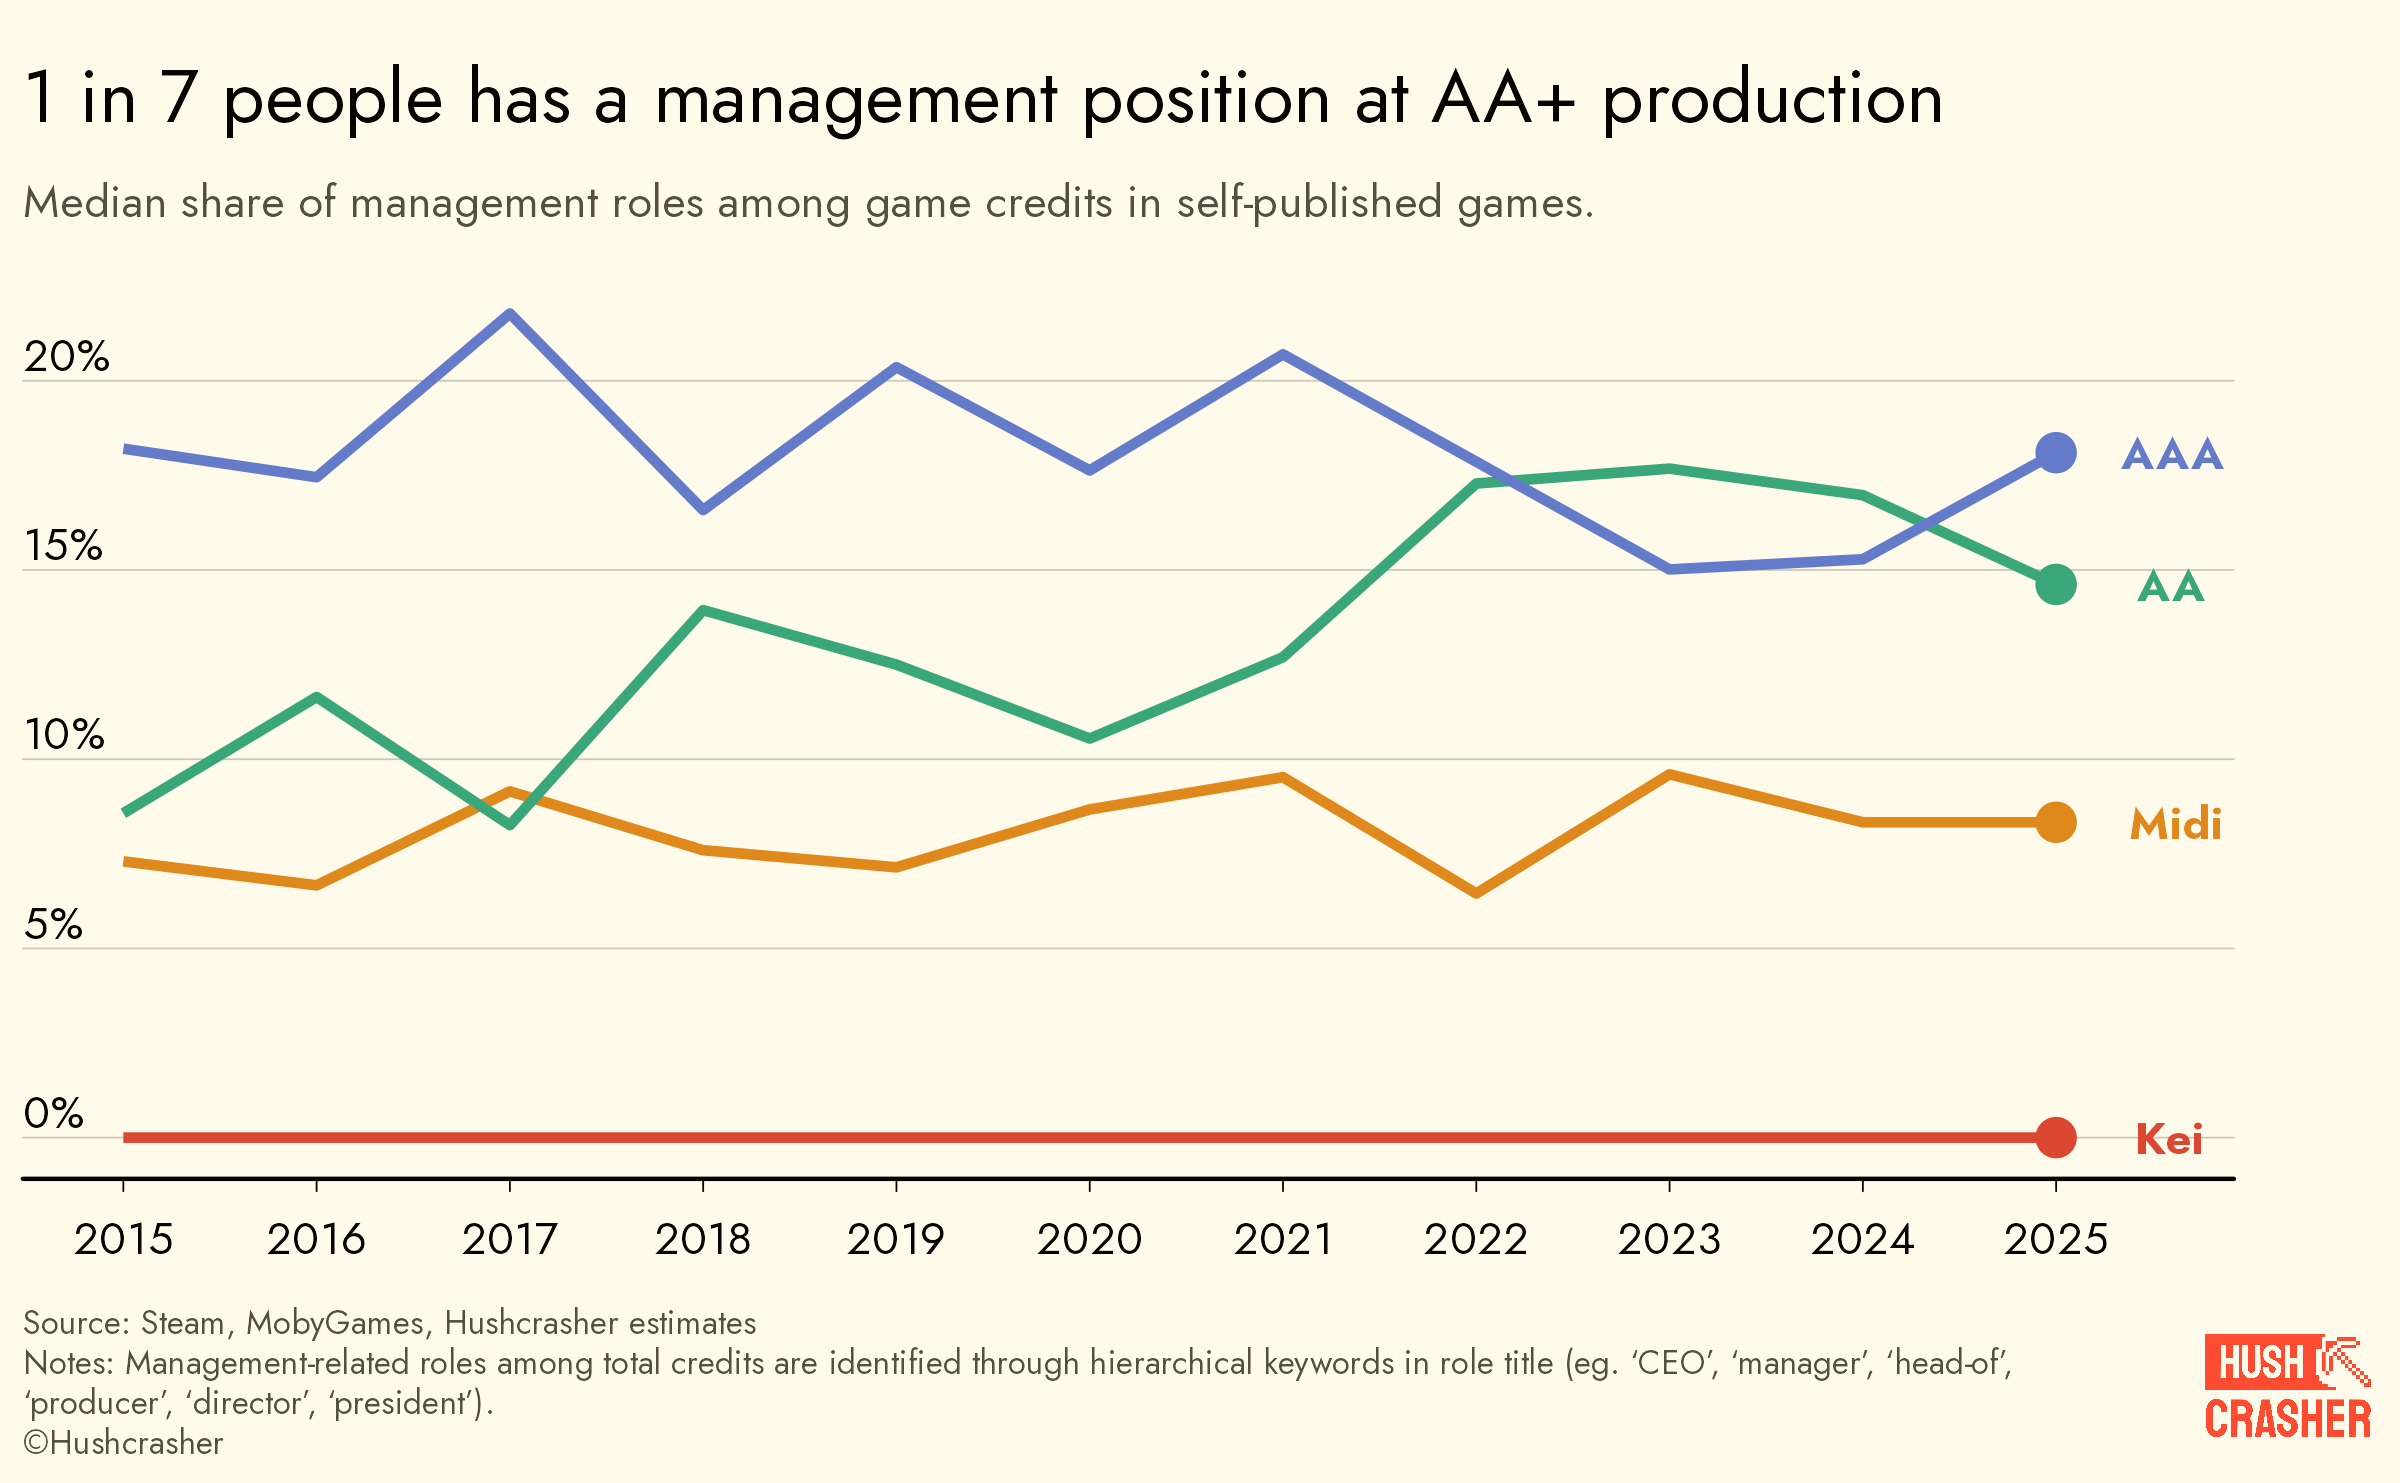
The real shift is in AA: their management share doubled over the last decade. From under 10% (Midi territory) to 15–17%, now matching AAA. Coordination is a tax. It raises costs without raising output. It’s likely why labor cost hits AA+ budgets so hard.
No more free overtime?
Lastly, there might also be a quieter force at play: (hopefully) studios are gradually moving away from crunch culture. The same workload requires more people, not because anyone got slower, but because companies stopped extracting unpaid overtime. This hits AA+ harder because that’s where crunch was most entrenched. Matthew Ball briefly touched on this in his 2024 State of the Industry.
So that’s the historical picture: why budgets grew over the last decade. But if you’re a studio planning your next game or a publisher funding one, what you care about is what each piece of the puzzle actually costs today. A 3D game vs a 2D one, what’s the price tag? Adding multiplayer? Hiring more managers?
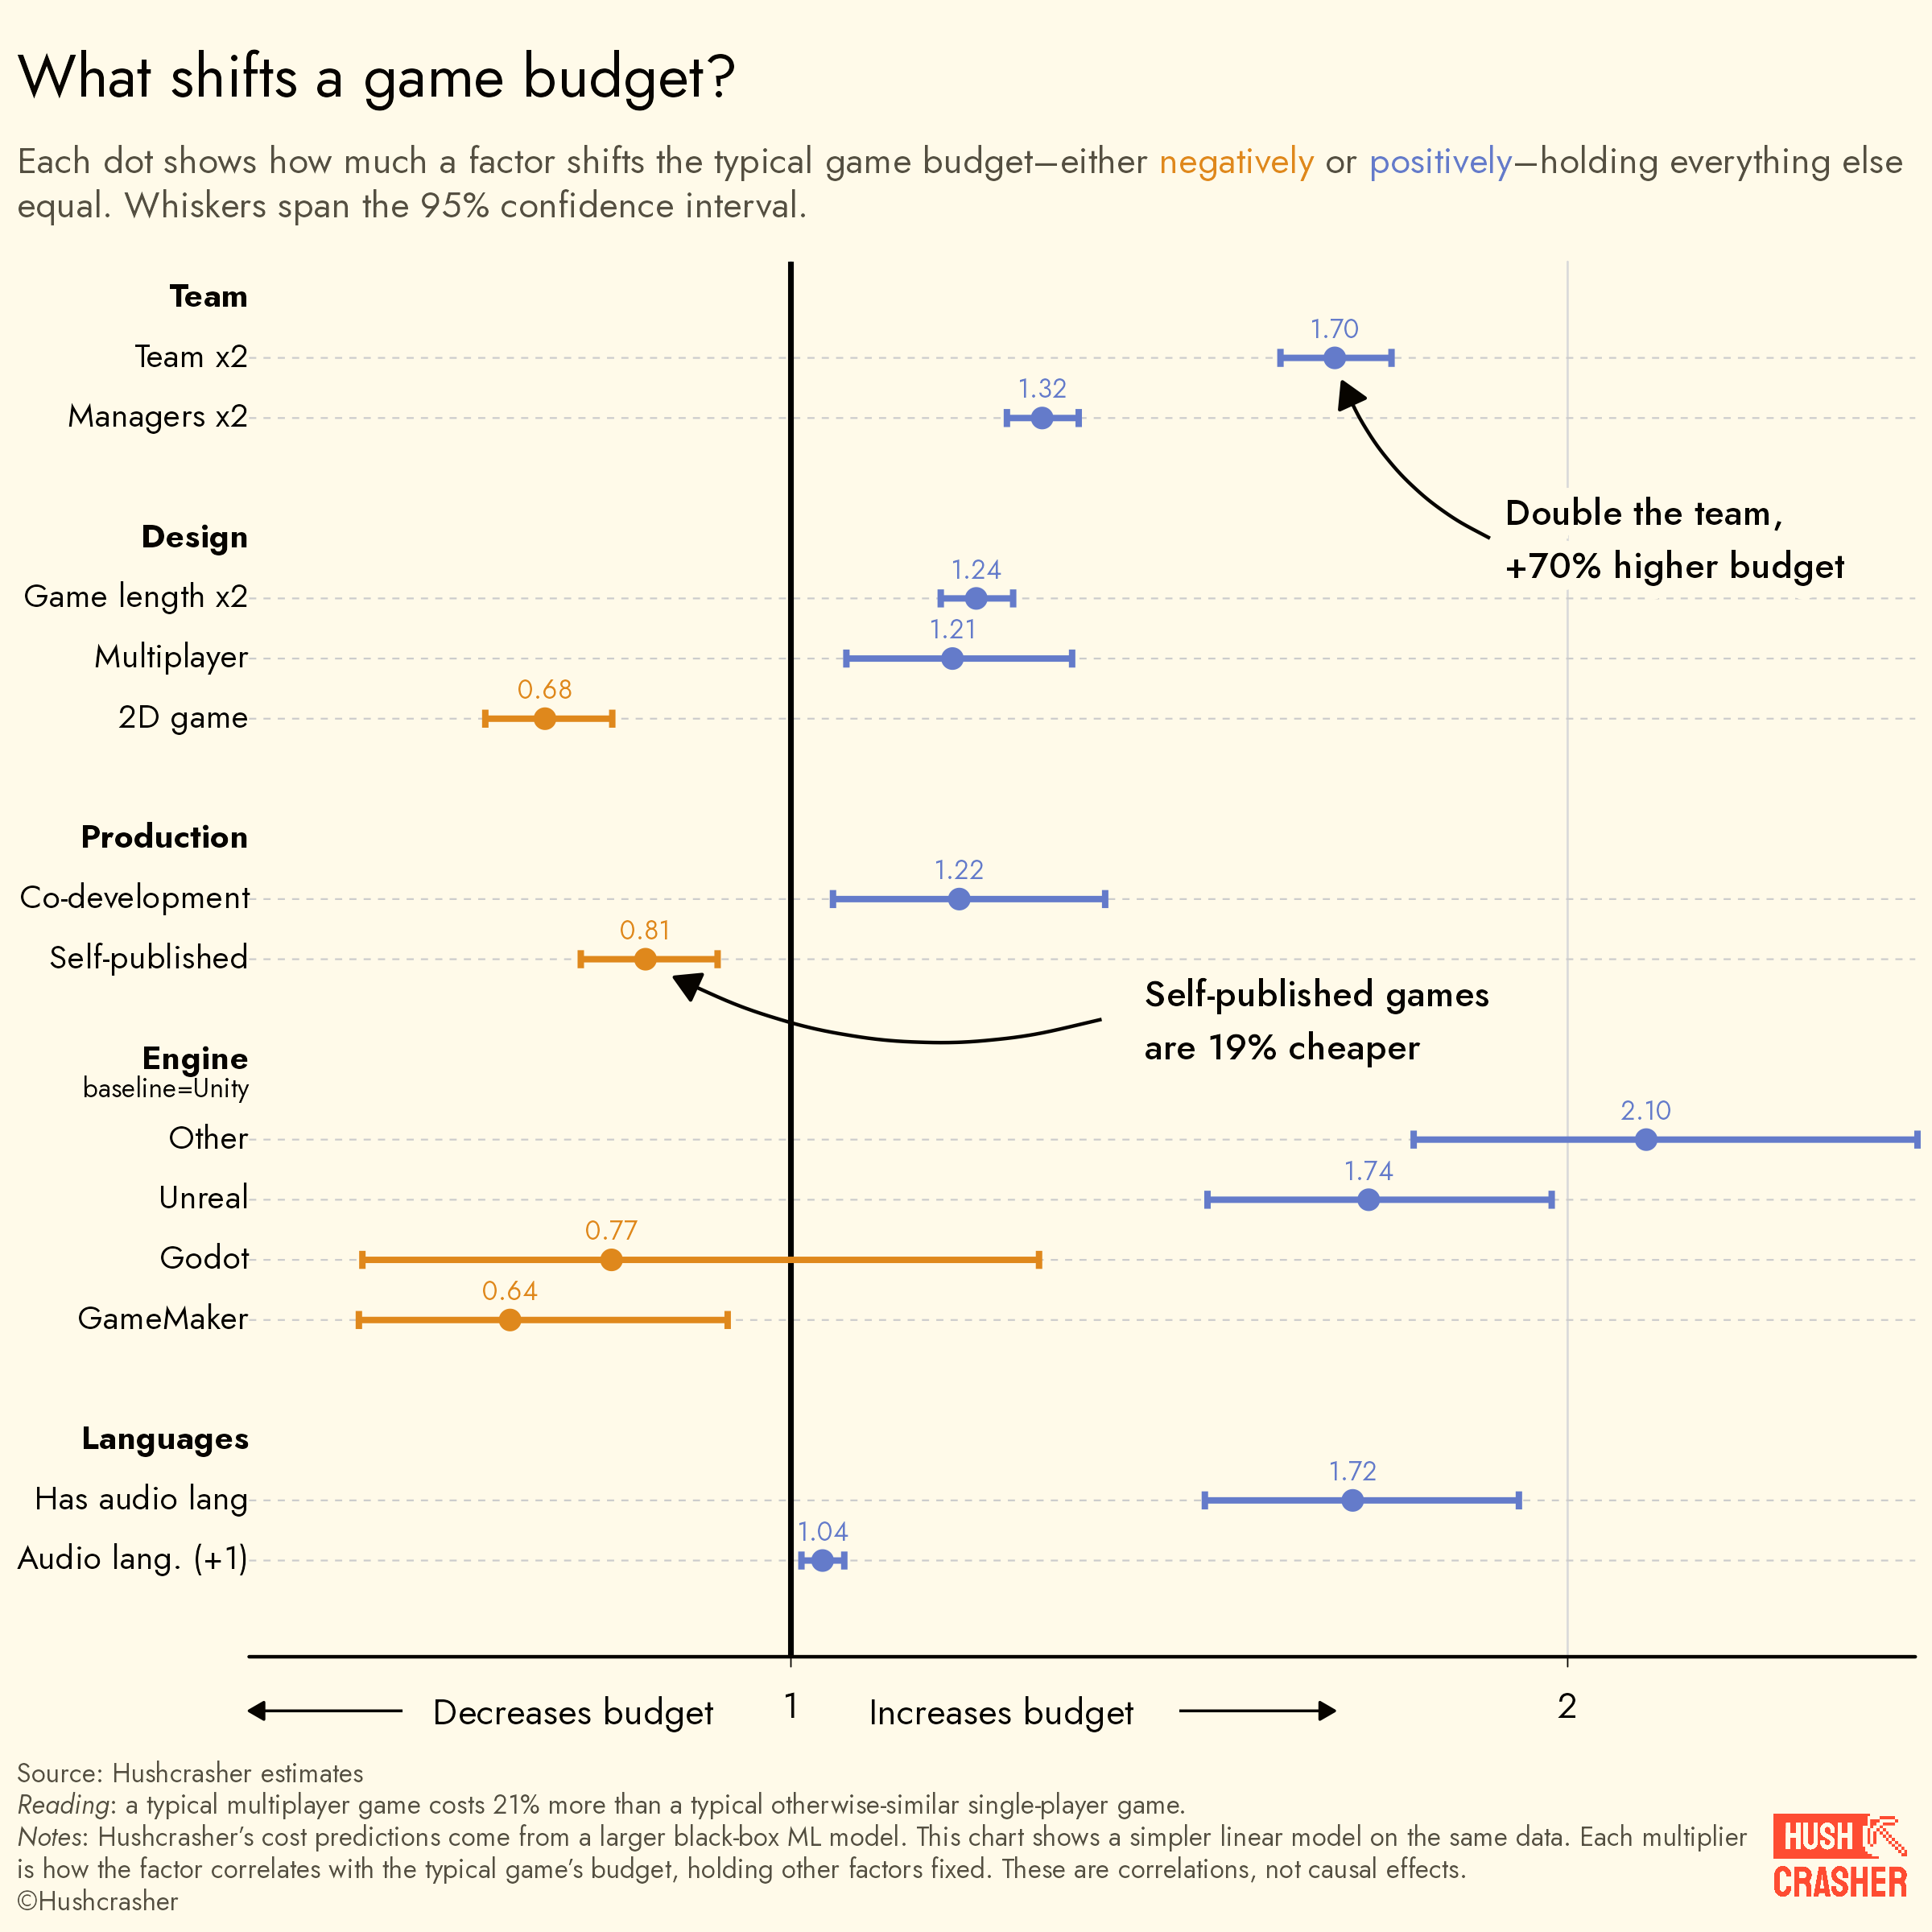
What shifts game development costs
The strongest predictor of budget is team size.5 Games with teams twice as large come with budgets ~70% higher on average. Worth distinguishing: labor wasn’t what pushed budgets up over the decade (scope was). Still, team size has always been the best predictor of how much a game costs. Doubling just the managers adds another 32%.
On the design side, the menu has clear price tags. A 2D game is 32% cheaper than its 3D equivalent. As Kei games are more and more 3D, that’s likely one of the main drivers of their scope increase. Multiplayer comes with ~+20% for the added complexity. Doubling the playtime leads to +24% budget. And having any voiced audio adds ~70%.
Production choices matter too. Self-publishing games trim ~20% off the bill (as we’ve speculated before, it could be a drop in resource investment efficiency). Co-development adds ~22% as coordination across teams is never free.
Want to benchmark your own project against these numbers? We packaged our model into the Budget Compass, a web app where you plug in your project features and get a predicted budget against the average for comparable games. It doesn't just give you a single number, but the full range of plausible budgets for projects like yours, from the most optimistic scenarios to the most demanding ones. It’s sharper on <$7M projects. It’s in alpha and reserved for our paid subscribers.
Unlock 4 months free by sharing some insights about your released (or soon-to-be-released) game. It helps us improve our benchmarks. We verify submissions within 24h, and all figures are protected under NDA. Get started here.
More ambitious games, not costlier ones
In the last decade, budgets have been rising across all scopes. Inflation played a part, but the bigger truth is that making the same game we used to make 10 years ago doesn’t cost more today. What’s been pushing budgets up is the never-ending chase for bigger scope.
Small studios pulled off bigger games with fewer hands. Bigger ones got specialized teams, hired more managers, and started paying for hours that crunch culture used to extract for free. Efficiency gains offset some of that, but not enough to cancel it out. That’s the why. Then we looked at the what: people, by far, are what moves the budget up (doubling the team adds 70%, doubling the managers another 32%). As for the rest, going 3D adds 32%. Going multiplayer, 20%. Voiced audio, 70%.
That being said, if you’ve been paying close attention, you know something is missing. We’ve been talking about team size the whole way through, never about paychecks. Inflation lifted everything by 28% in less than a decade, but did video-game salaries move with the broader economy, or did they pull ahead? If the cost of each developer has been climbing faster, that would be another driver hiding inside the “team” bucket we’ve been measuring.
Good news: we’ve gathered 4,600+ salary records from the past five years, across regions and seniorities. Subscribe to find out what it reveals.
Scope here means the measurable game characteristics that are related to scope that we could observe systematically for each game: length, 2D/3D, singleplayer/multiplayer, main tags, platforms, audio languages. Everything beyond that lands on in the residuals. The scope-then-team split is sequential. We ran both orderings and the story doesn’t move. See Fortin, Lemieux, and Firpo (2010) for a primer on decomposition methods.
This intuition was formalized by Becker & Murphy (1992): past a certain size, the gains from adding specialists get eaten by the cost of coordinating them. Bigger teams could sometimes produce less. Garicano (2000) extends this by putting communication cost at the center: a cheaper outsourced team in another timezone isn’t actually cheaper if you haven’t priced in the meetings, the rework, and the lead time to unblock decisions. The practical rule: outsource what’s well-specified and routine, keep in-house the work that generates exceptions and needs to escalate.
We restricted this analysis to self-published games. Because when a publisher is involved, their own management staff might show up in the credits and inflate the count.
We follow the global surrogate approach from interpretable machine learning (Molnar 2025): a simple linear model (the “surrogate”) is fit to our original model’s predictions using a subset of predictors. Its coefficients are associations observed across 100k+ games, not isolated causal effects. Read them as 'games with X tend to come in Y% higher,' not 'adding X to your project will raise the budget by Y%'.
Fascinating piece of analytics.
I think the central conclusion is directionally right: post-inflation budget growth is not simply a story of "the same games becoming more expensive".
A major part of the problem is that the industry keeps building broader, denser, harder-to-coordinate games.
That said, I would treat "scope" with some caution as an analytical category.
In AAA production, scope is not just content volume. It is not only the number of quests, hours, systems, platforms, cinematics, or supported languages. Those things matter, of course. But the deeper cost driver is dependency density: the number of systems, teams, assets, pipelines, approval layers, platform requirements, and content promises that must remain synchronized.
That is why the team decomposition section is, to me, the strongest part of the article.
Large games do not simply add more developers. They add more interfaces between developers. More handoffs. More reviews. More integration risk. More production management. More "coordination tax" you mention.
This is exactly the "kitchen sink game" problem you mention (and I can't agree more on the example chosen). The cost of a feature is not only the cost of that feature alone. It is the way that feature increases pressure across design, engineering, art, animation, QA, localization, certification, marketing, and live-ops readiness.
So I agree with the article’s broad framing, but I would phrase the conclusion slightly differently:
"AAA scope should be treated less as content volume and more as dependency density. And dependency density is ultimately a complexity governance problem".
There are also some methodological limits, which the article mostly acknowledges.
"Scope" has to be proxied through observable features, but many expensive AAA drivers are difficult to capture from public data: animation fidelity, systemic interdependence, quest reactivity, engine debt, production restarts, outsourcing complexity, cinematic density, management friction, anad so on.
The "other unobserved drivers" bucket is therefore important. It may contain real efficiency gains from tooling and pipelines, but it may also hide unmeasured scope expansion, technical debt, or production resets.
I would also separate "S-Tier" from AAA in future analysis. GTA VI and Call of Duty-scale projects operate under different capital-recovery, platform, franchise, and marketing logic than "ordinary" AAA games. They are not just larger AAA. They are a different strategic category.
Overall, though, this is a very useful analytical frame. The assumptions are stretched in places, and some classifications are necessarily rough, but the conclusion is valuable: modern game budgets are a scope-governance problem, not merely a labor-cost or inflation problem.
Good framing on dependency density. There's another dimension worth naming: decision instability.
Scope isn't only what you commit to at kickoff. It's everything you recommit to every time a stakeholder spends fifteen minutes with a build at an executive review and decides something feels wrong. That friction is invisible in credit counts. It doesn't show up as a new job title. It shows up as three weeks of an animator's time disappearing into a change that gets reverted two sprints later.
The coordination tax you've both identified is real, but a chunk of it isn't even coordination between specialists. It's the cost of absorbing decisions made by people who don't have enough contact time with the product to understand what they're actually changing. One directional pivot from above doesn't just touch the feature in question. It propagates through design, art, engineering, QA, and whoever had dependencies on the thing that just moved.
There's also the Mythical Man-month fallacy: the belief that a project running late can be rescued by adding people. Brooks wrote about this in 1975. Studios still do it. New hires don't slot into a pipeline, they interrupt it. Every experienced person on the team now has a junior to onboard while also trying to ship. Costs go up, throughput drops, and the date probably doesn't move.
So yes, scope is the main driver. But scope has a shadow cost that the decomposition can't easily capture: the rework generated by the gap between who makes decisions and who lives with them.